1 = Strong Republican
2 = Not Strong Republican
3 = Lean Republican
4 = Independent/undecided
5 = Lean Democrat
6 = Not Strong Democrat
7 = Strong Democrat
We hear a lot about political polarization these days.
Editorial pages and pundits and Uncle Fred on his Thanksgiving Day soapbox express quite a bit of wishing that our politicians would pay more attention to the reasonable, norms-loving moderates in the middle.
But is there anybody there?
In his book, The Partisan Sort: How Liberals Became Democrats and Conservatives Became Republicans (2009, U of Chicago Press) Matt Levendusky suggests that almost everyone has chosen up sides.
To make it easier for inattentive, unstudious, and busy-with-other-stuff normal folks to figure out which party more closely aligns with their worldview, party leaders have redefined and amplified the differences between what it means to be Republican and Democrat.
And, especially lately, they’ve also implied that the opposing party is an existential threat to “our” way of life.
Now, before you go “so I guess that means people should be more attentive and studious about politics,” there’s some convincing research suggesting that the more you pay attention to politics, the more partisan you get.* So maybe that’s been happening too.
Either way, while our sentiments may make us wish for a return to a comforting centrist sensibility in our national politics, it looks like we’re running short on centrists to lead that return.
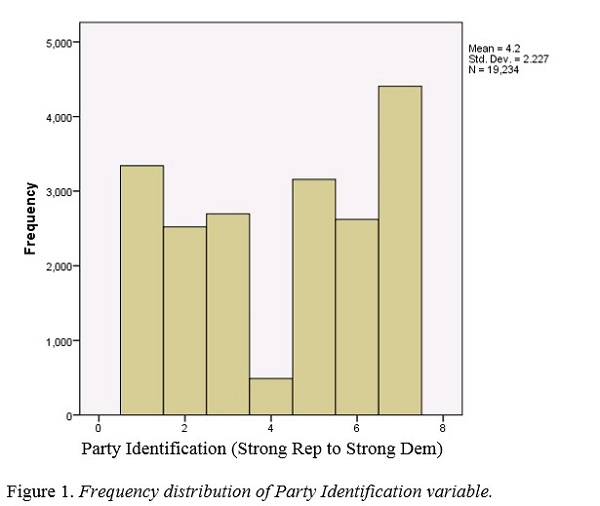
Normally, the distribution of almost anything along any continuum forms what is called a “normal curve,” with the fattest part in the middle of a relatively symmetrical arrangement of whatever population of people or things or other data points have ben measured. And the larger the population, the more “normal” the arrangement tends to be. The chart shown in Figure 1 was constructed using data from a recent American National Election Survey (ANES). It shows that, where politics are concerned, things are no longer normal.
As can be seen in Figure 1, the values for political party identification exhibited almost a perfect reverse of a normal distribution.
This may have been a function of the survey question, which asked respondents to identify themselves as one of the following: “Strong Democrat,” “Not Strong Democrat,” “Lean Democrat,” “Independent/other/undecided,” “Lean Republican,” “Not Strong Republican,” or “Strong Republican.”
Apparently, partisans did not seem to want to characterize themselves as “Not Strong.”
And hardly anyone was willing to be “Undecided.”
* Check out the work of Markus Prior